Ellisys Bluetooth Tracker - Screenshots
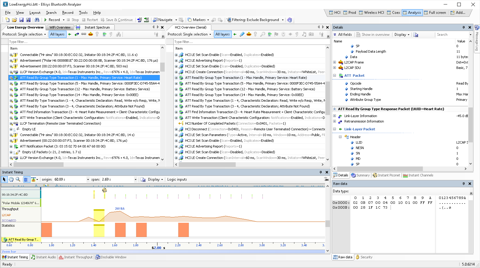
Protocols and Profiles
Bluetooth LE, Wi-Fi, and HCI protocols and profiles are displayed in an easy-to-understand,
high-level procedures-oriented chronological format in their respective Overview window
and fully detailed to the lowest bit/byte level in the linked Details view.
All traffic is displayed in designated
Overviews real-time, as capture progresses.
The user is provided a rich set of controls to easily customize any Overview, including
powerful filtering and coloring capabilities designed to quickly isolate specific
protocols, profiles, or communications of interest. Traffic can be presented
at the highest level of abstraction and the user can drill down to show all
intermediate levels, down to the most basic elements, such as packet-only views.

Click the image to expand it
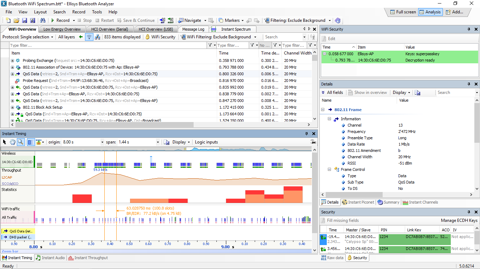
Wi-Fi Analysis [Enterprise]
The Tracker includes an integrated Wi-Fi capture capability that allows for precision synchronization with all other wired and wireless traffic captured by the analyzer (Bluetooth LE, logic signals, HCI). Wi-Fi traffic is presented in a dedicated Overview window and presented chronologically in a flexible and very configurable high-level procedures-oriented format. Wi-Fi packets are shown in the Instant Timing and Instant Spectrum windows to provide accurate and comprehensive understandings of Wi-Fi sequences, timings, as well as coexistence characterizations. A convenient Wi-Fi Security view allows for entry of passkeys. Various exports allow for display of Wi-Fi protocols in popular third-party formats.
Click the image to expand it
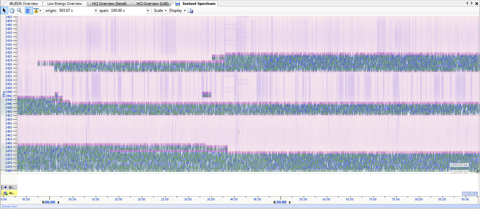
Spectrum Analysis [Enterprise]
The 2.4 GHz ISM band used by Bluetooth LE is quite busy. Other users of
this band include Wi-Fi, LTE, ZigBee, ANT and a broad range of other proprietary
and commercial technologies. These users interfere with each other and
it is often necessary to have a better understanding of the wireless environment.
The Instant Spectrum display is the perfect tool for
coexistence debugging, wireless characterization, or simply for visualizing
the RF environment. It captures and synchronously displays all wireless packets, including the RF signatures and signal strength (RSSI) of all emitters, including Bluetooth LE and Wi-Fi transmissions, and all other RF in the Bluetooth spectrum. A configurable precision of up to 1 microsecond is provided.
Click the image to expand it
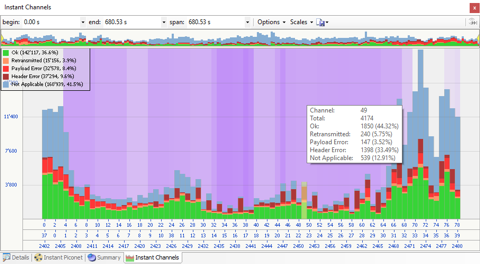
Instant Channels [Standard]
Root-causing transmission and reception issues are critical to understanding the reliability of Bluetooth LE communications. The spectrum in which Bluetooth LE operates is quite busy with many other RF emitters, including Wi-Fi, telephonic communications equipment, and even microwave ovens. The Instant Channels view is very useful in determining which channels are being avoided by any given link, characterizing transmission errors and retransmissions on a per-channel basis, and understanding the progression of these characteristics over time.
Click the image to expand it
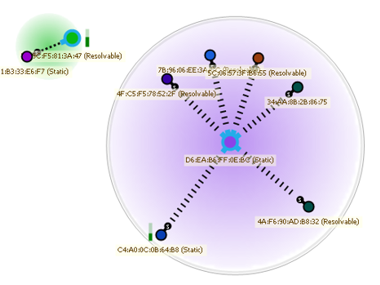
Instant Piconet [Standard]
Once a capture is initiated, the user is provided with a dynamic and intuitive depiction of Bluetooth topologies as they evolve. The Instant Piconet pane displays a graphical representation of devices, piconets, and mesh network, along with connection and topology characteristics, throughput, and RSSI indications. On saved traces, the user can step through topology changes to visualize these events.
Click the image to expand it
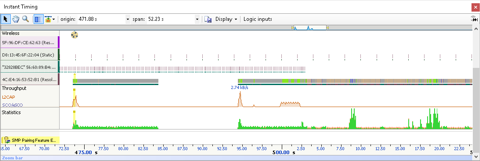
Instant Timing [Standard]
Timing issues are a primary concern to wireless developers. Low-level timing errors can cause serious application issues and can be near impossible to isolate without proper tools like the Tracker and its Instant Timing feature. The Instant Timing pane provides a unique and intuitive way to precisely understand various timing characteristics of and between Bluetooth LE and Wi-Fi traffic, HCI packets, external logic signals, throughput characteristics, error and retransmission graphics, and connection events.
Bluetooth LE and Wi-Fi packets are presented chronologically left to right and are uniquely color-coded per the packet’s sender.
The Instant Timing pane provides various approaches for timing characterizations. Tools are provided for slot timings, two types of timing cursors, zoom and pan features, detailed packet flyovers, color-code assignments to devices, and a multitude of other powerful characterization and navigation features.
Click the image to expand it
Logic Analysis [Pro]
The logic analysis feature enables capture up to 16 logic signals, in synchronization
with any other captured wireless and wired traffic. Any digital signal is supported, including
general-purpose I/Os (GPIOs) or dedicated pins such as TX/RX Active. Another of the
many applications for this feature is keeping track of a device’s power
consumption in various states, by using dedicated hardware such as comparators
for determining whether key thresholds are exceeded.
These signals can then be visualized with 5-nanosecond precision and compared
with the other captured streams in the powerful Instant Timing view of the Ellisys
software.

Click the image to expand it
HCI Analysis [Pro]
Wireless traffic is of course one of the most useful elements of debugging
information for Bluetooth LE engineers, but Host Controller Interface (HCI)
traffic is an equally important complement of information for getting a clear
and complete picture of the situation.
HCI is an electrical interface defined by the Bluetooth LE specification
for communications between the host controller and the radio. The Tracker
supports synchronized capture of UART HCI and SPI HCI. All HCI traffic
is captured concurrently with the wireless traffic using the same precision
clock for perfect synchronization and timing analysis, and is displayed in
the highly-optimized Ellisys analysis software.
HCI capture is also a very convenient feature when working with devices that
implement BLE Secure Connections. The Ellisys analysis software automatically
extracts any Link Key exchanged over HCI and uses it to decrypt the wireless
traffic, all without any user interaction.
Click the image to expand it
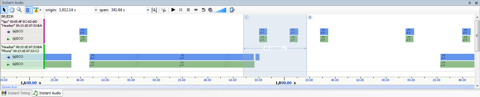
Audio Analysis
Captured audio streams can be easily played back, even during capture. LC3 traffic is automatically detected using a test equipment-grade LC3 codec, even without capture of LC3 configuration traffic. Finding packets carrying specific audio portions or at specific events is easily done.
Audio captured over HCI or from an Audio I2S input [PRO] can be played back. This enables characterization of the complete audio chain, including the uncompressed audio provided to the source, the audio transmitted wirelessly, and the decoded audio at the receiver device. Audio streams are exportable to WAV format.
Click the image to expand it
Message Sequence Charts
While the Tracker’s powerful protocols and profiles display is most
efficient for engineers, Message Sequence Charts are usually preferred for
creating reports or sharing technical information with specification experts
or others not typically involved in using protocol analysis tools. The Ellisys
solution is to create a Message Sequence Chart representation from a previously
filtered and annotated protocols view. With this approach, engineers can include
precisely the information they want, the way they want, and create a clear
depiction showing exactly the information desired.

Click the image to expand it
Automated and Long-Term Capture
There are various user applications that require the use of the analyzer
in an automated fashion, often under control of user-defined software applications
performing a variety of tasks. These applications may include long-term test
environments, integration of the analyzer into a mobile platform, and other
usage models.
Thanks to the ease-of-use and robustness provided by the Ellisys Digital
Radio, the Tracker is the perfect system for these tasks. The analyzer can
be controlled with a simple yet powerful Remote Control API (Application
Programming Interface) to programmatically start / stop / save captures, and
extract specific captured information that can be used for various purposes,
including go/no-go testing , all without any manual operation.
A unique segmentation feature works seamlessly with the API to allow for
extremely long captures, segmenting captures into smaller more manageable
slices while maintaining topology and contextual information from capture to
capture.
Next page »
More
» Product Overview
» Technical Specifications
» Software Download
» Purchase
|